The BLOG
Data Analytics
Helping Businesses Succeed With Data Analytics
Overview
Data analytics is one of the up-and-coming technology solutions for businesses to answer questions. If you’ve never heard or used data before, essentially it is the raw output from your business systems. This can include health records, point of sale machines, website, Amazon/Shopify/eBay pages, email…etc. You get the idea. Data is everywhere which is a blessing and a curse. How do you use this to help your business succeed?
It’s more than fancy graphs, right?
Of course it is. Data is the output of your workflows, processes, systems, software, users, etc. and can be used to help your understand what’s going on behind the scenes. The most important part of the process is understanding. Looking at raw data is like trying to make sense of a book without reading every page. Taking a page out of context can hinder the processes and prevent the rest of the book from making sense. Starting at the beginning and working your way to the end will provide the most value and benefit.
What’s the process?
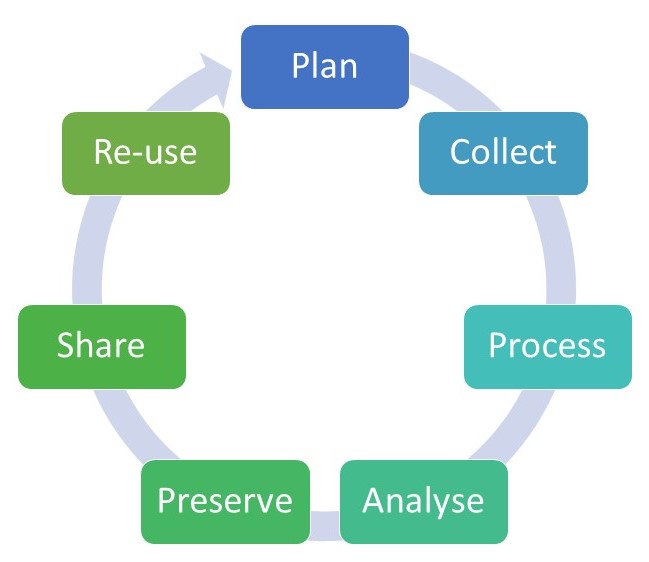
It’s easy to become excited and quickly start building reports, purchasing software, or hiring developers/analysts. However, rushing into this process can hurt your business rather than helping. It’s very important to follow the data process:

The steps above are revolving, never fully completed. The reason for this is your business needs change, your processes change, and most importantly, your data changes.
1. Plan
Planning what you’re trying to accomplish is crucial. It allows creation of scope to prevent plunging down rabbit holes which, in turn, helps complete the first revolution of the process much sooner. When planning, make sure to establish the “Who”, “What”, “Why”, “How”, and “When” questions to prevent extra work. Key questions to ask are:
- Who will use this report?
- How will they make decisions with it?
- Why will they need this?
- When should I have this done by?
- What is it representing?
2. Collect
Collecting data is the next step in your data journey. You can’t report on data you don’t have. By preparing and collecting data, you can answer every business question.
3. Process
This step and the next will recur several times within the lifecycle. This is called the “Data Discovery” phase. You will start to understand what data you have, the quality issues presented, and how you could use it in conjunction with other datasets to provide the highest quality reports. However, this is also the time where you begin to implement process improvement, quality measurements, and will most likely feel the most frustration. Don’t worry, every organization goes through this and we all struggle with it. The benefits outweigh the negatives in that this process will help to understand workflow and data flow problems, bugs in coding/software, and root causes of many of your organizations pain points.
4. Analyze
This is where things start to get fun. You’ve finally gathered and began understanding your businesses’ data but now you have to figure out what data you truly have. What does this mean? How do I use this to answer business questions? How do I make sense of this? These are all valid questions you should be asking yourself, the business owners, stakeholders, or system managers. Depending on the size of your business, this will vary but the most important thing is to ask the right people because assumptions can create significant confusion.
5. Preserve
Now that you understand your data, you’ve designed reports for business questions, potentially with answers, and you’re ready to move on. But wait! You just spent all that time setting up processes to capture and store your data, how do you repeat this moving forward? This is where things can become tedious, boring, and dreadful. No one enjoys documentation, spending all day typing out notes, or whatever processes you’ve had to implement. However, by maintaining these, you keep your data accurate and can maintain trust in the report that what it says is true. This step will depend on the content of your report, but developing additional ways of measuring accuracy can eliminate manual validation and ensure your report is trustworthy without any additional work on your part.
6. Share
This is the most fun step in the process. You get to show off your work and present your findings to stakeholders, customers, and employees. Depending on the complexity, here are a couple things to keep in mind:
- A report without proper context might as well be inaccurate.
- Stay at a high level, explaining only the minimum necessary and encourage questions. Otherwise, you’ll lose your audience.
- Read the room. Understand who you’re presenting to. If it’s customers, explain how it can benefit them. If it’s executives, explain how they can use it to make decisions or how it’ll impact the business. If it’s management, explain how they can use it to be better managers and understand their team. If it’s quality improvement, explain which processes can be more efficient and how to use it to measure performance.
- Most importantly, DON’T EXPLAIN THE WEEDS UNLESS YOU’RE ASKED. I can’t tell you how many times I’ve had to build custom software, automated processes, simplified formulas, and fixed data. Unless it pertains to them, they’re your customers and you don’t want to confuse them.
Have Questions? Let’s get in touch.
Helping businesses succeed is the reason I started this company. Data can truly help your company grow but it takes a lot to get there. That’s why we’re here to answer questions, help with implementation, data discovery, or report creation. Let’s talk!
